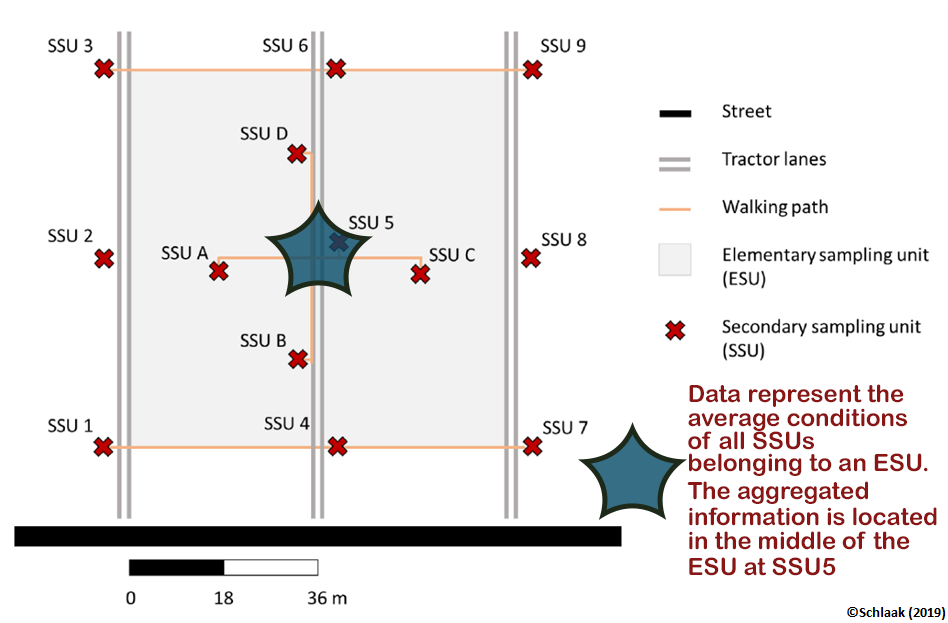
ESU Statistics: The visualized data represent the average conditions of all SSUs belonging to an ESU. The information is located in the center of the ESU (SSU5).
[min_ = minimum; max_ = maximum; median_ = median, mean_ = arithmetic mean, std_ = standard deviation]
| Shortcut | Mapping Date | Field-no. | Campaign-no. | ESU | Latitude | Longitude | Crop |
|---|---|---|---|---|---|---|---|
| F2ESU1 | 2022-04-12 | 2 | 1 | 1 | 53.87164 | 13.2591552 | Winterwheat |
| F2ESU1 | 2022-05-03 | 2 | 2 | 1 | 53.87164 | 13.2591552 | Winterwheat |
| F2ESU1 | 2022-06-09 | 2 | 3 | 1 | 53.87164 | 13.2591552 | Winterwheat |
| F2ESU1 | 2022-06-28 | 2 | 4 | 1 | 53.87164 | 13.2591552 | Winterwheat |
| F2ESU3 | 2022-04-12 | 2 | 1 | 3 | 53.867582 | 13.2683047 | Winterwheat |
| F2ESU3 | 2022-05-03 | 2 | 2 | 3 | 53.867582 | 13.2683047 | Winterwheat |
| F2ESU3 | 2022-06-09 | 2 | 3 | 3 | 53.867582 | 13.2683047 | Winterwheat |
| F2ESU3 | 2022-06-28 | 2 | 4 | 3 | 53.867582 | 13.2683047 | Winterwheat |
| F2ESU2 | 2022-04-12 | 2 | 1 | 2 | 53.869043 | 13.258388 | Winterwheat |
| F2ESU2 | 2022-05-03 | 2 | 2 | 2 | 53.869043 | 13.258388 | Winterwheat |
| F2ESU2 | 2022-06-09 | 2 | 3 | 2 | 53.869043 | 13.258388 | Winterwheat |
| F2ESU2 | 2022-06-28 | 2 | 4 | 2 | 53.869043 | 13.258388 | Winterwheat |
| F1ESU1 | 2022-04-13 | 1 | 1 | 1 | 53.8945604 | 13.2499103 | Winterwheat |
| F1ESU1 | 2022-05-04 | 1 | 2 | 1 | 53.8945604 | 13.2499103 | Winterwheat |
| F1ESU1 | 2022-06-07 | 1 | 3 | 1 | 53.8945604 | 13.2499103 | Winterwheat |
| F1ESU1 | 2022-06-27 | 1 | 4 | 1 | 53.8945604 | 13.2499103 | Winterwheat |
| F1ESU3 | 2022-04-13 | 1 | 1 | 3 | 53.8897298 | 13.2454408 | Winterwheat |
| F1ESU3 | 2022-06-08 | 1 | 3 | 3 | 53.8897298 | 13.2454408 | Winterwheat |
| F1ESU3 | 2022-06-27 | 1 | 4 | 3 | 53.8897298 | 13.2454408 | Winterwheat |
| F1ESU2 | 2022-04-13 | 1 | 1 | 2 | 53.892253 | 13.2477485 | Winterwheat |
| F1ESU2 | 2022-05-04 | 1 | 2 | 2 | 53.892253 | 13.2477485 | Winterwheat |
| F1ESU2 | 2022-06-08 | 1 | 3 | 2 | 53.892253 | 13.2477485 | Winterwheat |
| F1ESU3 | 2022-05-04 | 1 | 2 | 3 | 53.8897298 | 13.2454408 | Winterwheat |
| F1ESU2 | 2022-06-27 | 1 | 4 | 2 | 53.892253 | 13.2477485 | Winterwheat |