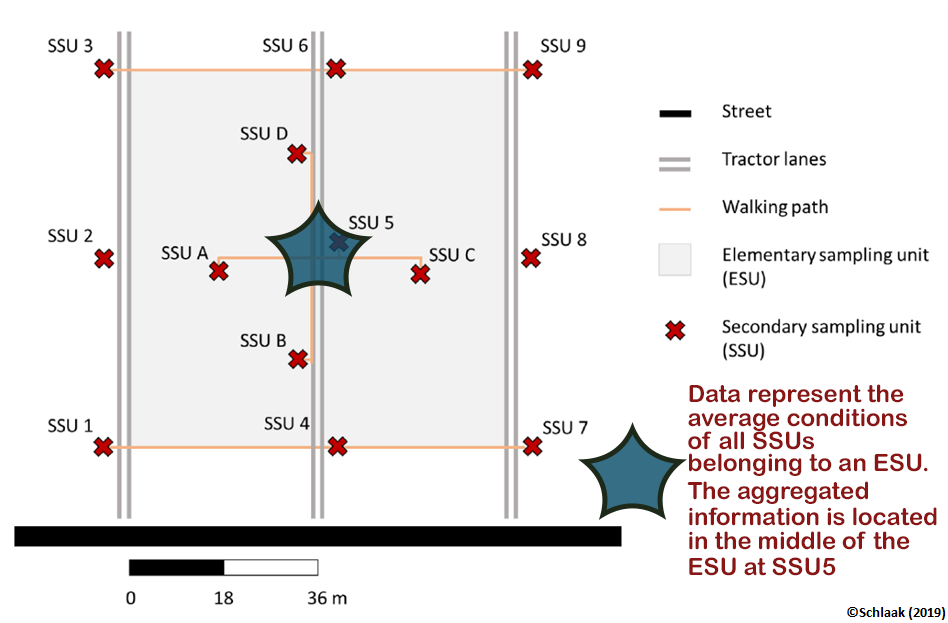
ESU Statistics: The visualized data represent the average conditions of all SSUs belonging to an ESU. The information is located in the center of the ESU (SSU5).
[min_ = minimum; max_ = maximum; median_ = median, mean_ = arithmetic mean, std_ = standard deviation]
| Shortcut | Mapping Date | Field-no. | Campaign-no. | ESU | Latitude | Longitude | Crop |
|---|---|---|---|---|---|---|---|
| F1ESU1 | 2024-05-03 | 1 | 1 | 1 | 51.5501968142781 | 11.8728679459901 | Rye |
| F2ESU1 | 2024-05-04 | 2 | 1 | 1 | 51.5497200427964 | 11.8748243679217 | Rye |
| F3ESU1 | 2024-05-04 | 3 | 1 | 1 | 51.4360752472937 | 11.7647581709572 | Spelt |
| F1ESU1 | 2024-05-07 | 1 | 2 | 1 | 51.5501968142781 | 11.8728679459901 | Rye |
| F2ESU1 | 2024-05-14 | 2 | 3 | 1 | 51.5497200427964 | 11.8748243679217 | Rye |
| F3ESU1 | 2024-05-23 | 3 | 4 | 1 | 51.4360752472937 | 11.7647581709572 | Spelt |
| F1ESU1 | 2024-06-04 | 1 | 5 | 1 | 51.5501968142781 | 11.8728679459901 | Rye |
| F2ESU1 | 2024-06-05 | 2 | 5 | 1 | 51.5497200427964 | 11.8748243679217 | Rye |
| F3ESU1 | 2024-06-18 | 3 | 6 | 1 | 51.4360752472937 | 11.7647581709572 | Spelt |